Appendices
Mixed Material Collections Containing Maps
Create a catalog record following DACS. Apply the guidelines in the Yale University Library Manuscript Cataloging Guidelines and the Beinecke MS Unit’s Cataloging Manual.
If the cartographic material is significant to the collection, add to the collection-level record:
- 006 for “manuscript map”
- 651 for the geographic area(s) covered, with subfield ‡v Maps.
- 655 ‡a Manuscript maps. ‡2 lcgft , and any other specific terms as applicable.
If creating analytic records for individual cartographic components of the collection, use the directives in this manual.
Map Collections Using DCRM(C)
Code your catalog record as dcrmc, record type f, bibliographic level c for collection. Refer to Appendix B Collection-Level Records of DCRM(C) (p. 207-222) for more guidance. In particular:
034 and 255: If all of the items in the collection have the same scale, projection, or coordinates, supply a 034 and a 255 like single items.
- Optionally, if not all the items in the collection have the same coordinates, record the coordinates that express the overall geographic coverage of the collection as a whole.
- If the items are of more than one scale, give the statement “Scales differ” in 255.
- Otherwise do not use those fields.
300: Optionally give item or volume count instead of linear footage.
300 __ ‡a 20 ‡f maps (in 3 boxes)
Record examples
Atlas:
François Azan, Plans de plusieurs ports, rades, mouillages, caps, bancs, et dangers, GEN MSS VOL 695. Single map:
Ernest W. Branch, Lakeside Park Annex, Tewksbury, GEN MSS 1535.
Tools
(Also linked in the relevant fields)
- Bounding Box, Klokan Technologies. https://boundingbox.klokantech.com/ [1]
- Cartographic Data Source Codes, Library of Congress.
https://www.loc.gov/standards/sourcelist/cartographic-data.html [2]
- Cartographic Materials 655 Form/Genre Headings, Cataloging @ Yale.
https://web.library.yale.edu/cataloging/cartographic/655 [3]
- Degrees Minutes Seconds to/from Decimal Degrees converter, Federal Communications Commission.
https://www.fcc.gov/media/radio/dms-decimal [4]
- Map Scale Calculator, MapTools.
https://maptools.com/scale_calculator [5]
- MARC Code List for Geographic Areas, Library of Congress
https://www.loc.gov/marc/geoareas/gacs_name.html [6]
- Subclass G (Cartographic Materials) - Geographic Cutter Numbers table from the Library of Congress (https://www.loc.gov/catdir/cpso/GCutter.pdf [7]) (keyword-searchable pdf document)
Reference Resources
- Cartographic Cataloging, Cataloging @ Yale.
https://web.library.yale.edu/cataloging/cartographic [8]
- DCRM(C). https://rbms.info/dcrm/dcrmc/ [9].
- Larsgarrd, Mary. Maps and Related Cartographic Materials: Cataloging, Classification, and Bibliographic Control. Routledge, revised edition 2013.
https://books.google.com/books?id=ZD19HBFhag8C [10]
- Relevant documentation from the Beinecke Library’s Rare Book Unit:
Map cataloging: http://beinecke1.library.yale.edu/info/bookcataloging/map_cataloging.htm [11]
Atlases: http://beinecke1.library.yale.edu/info/bookcataloging/atlases.htm [12]
Glossary
(For more terms, see DCRM(C) p. 337-359)
Atlas: A volume of maps, plates, engravings, tables, etc., with or without descriptive text.
Geographic coordinates: Coordinates on Earth in terms of latitude (the north–south position of a point on the Earth’s surface) and longitude (the east–west position of a point on the Earth’s surface). Expressed in decimal degrees or in degrees/minutes/seconds.
Neat line: A line, usually grid or graticule, that encloses the detail of a map.
Projection: Mathematical constructs used to represent a geographic surface that is three-dimensional on two-dimensional surface.
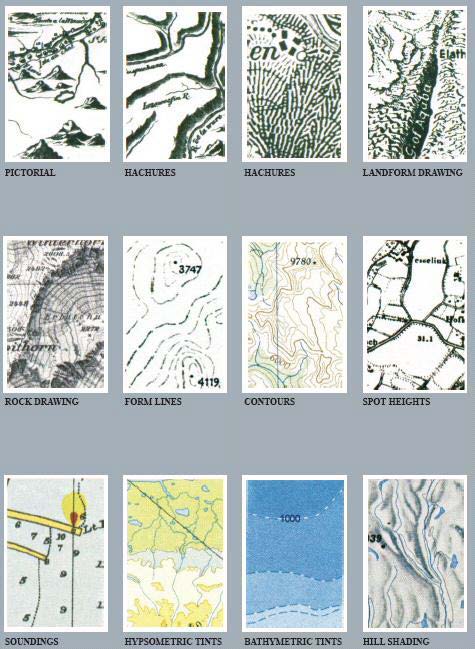
Relief: Inequalities of elevation and the configuration of land features on the surface of the Earth that may be represented on maps or charts by contours, hypsometric tints, shading, spot heights, hachures, etc. (see image below).
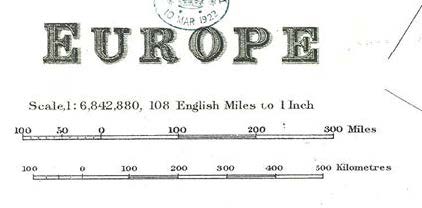
Scale: The ratio of distances on a map, or other cartographic item, to the actual distances they represent on earth. Scale gives an indication of a map’s level of detail. Statements of scale appear in various forms, including the representative fraction (“1:24,000”, which is the same as “1/24,000”), a verbal scale (“A hundred miles to an inch” “1 inch = 1 mile”), and a bar/graphic scale.